Greenhouse Gas Emissions - www.ussteel.com
PROTECTING OUR PLANET
GREENHOUSE GAS EMISSIONS
Although producing steel is carbon-intensive, we have a roadmap to get to net-zero Scope 1 and Scope 2 emissions by 2050. Approximately 70% to 80% of the greenhouse gas (GHG) emissions from integrated steelmaking are associated with the use of coke and coal to melt iron in blast furnaces. U. S. Steel has always strived to be on the leading edge of the most energy-efficient production of steel using blast furnaces. Further, we are making steel by melting recycled steel scrap using electricity in electric arc furnaces (EAFs), which produces significantly less GHG emissions. U. S. Steel recognizes the importance of having both routes of steel production while transitioning to a lower-carbon economy.
In 2021, U. S. Steel published a Climate Strategy Report, which outlines our vision for achieving our net-zero goal.
Our progress toward lowering our Scope 2 emissions will continue through 2024 with important milestones. For example, U. S. Steel's second mini mill, BR2, is expected to start up in 2024, which will likely reduce our GHG emissions intensity. Entergy Arkansas’ Driver Solar project, which is located adjacent to the Big River Steel Works operations, will begin providing Big River Steel Works with up to 250 MW of solar power later this year, significantly increasing Big River Steel Works' use of renewable energy.
GHG EMISSIONS (MILLION METRIC TONS CO₂E)
| SCOPE 1 | 2021 | 2022 | 2023 |
|---|---|---|---|
| U.S. Operations | 20.04 | 18.70 | 19.26 |
| USSK Operations | 8.98 | 7.32 | 7.97 |
| Total | 29.03 | 26.02 | 27.23 |
| MARKET-BASED SCOPE 2 | 2021 | 2022 | 2023 |
|---|---|---|---|
| U.S. Operations | 2.55 | 2.58 | 2.16 |
| USSK Operations | 0.08 | 0.13 | 0.12 |
| Total | 2.63 | 2.71 | 2.28 |
GHG INTENSITY (METRIC TONS CO2E/METRIC TONS RAW STEEL)
| SCOPE 1 | 2021 | 2022 | 2023 |
|---|---|---|---|
| U.S. Operations | 1.68 | 1.70 | 1.64 |
| USSK Operations | 2.01 | 2.10 | 2.00 |
| Total | 1.77 | 1.80 | 1.73 |
| MARKET-BASED SCOPE 2 | 2021 | 2022 | 2023 |
|---|---|---|---|
| U.S. Operations | 0.21 | 0.23 | 0.18 |
| USSK Operations | 0.02 | 0.04 | 0.03 |
| Total | 0.16 | 0.19 | 0.15 |
GHG INTENSITY - NORTH AMERICA BY BUSINESS SEGMENT
| SCOPE 1 INTENSITY | MARKET-BASED SCOPE 2 INTENSITY | TOTAL INTENSITY | |
|---|---|---|---|
| Integrated (Metric tons CO2e/metric tons raw steel) | 1.94 | 0.04 | 1.98 |
| Mini Mills (Metric tons CO2e/metric tons raw steel) | 0.20 | 0.13 | 0.33 |
| Tubular (Metric tons CO2e/metric tons raw steel) | 0.36 | 0.43 | 0.79 |
| Pellets (Metric tons CO2e/metric tons pellets) | 0.09 | 0.05 | 0.14 |
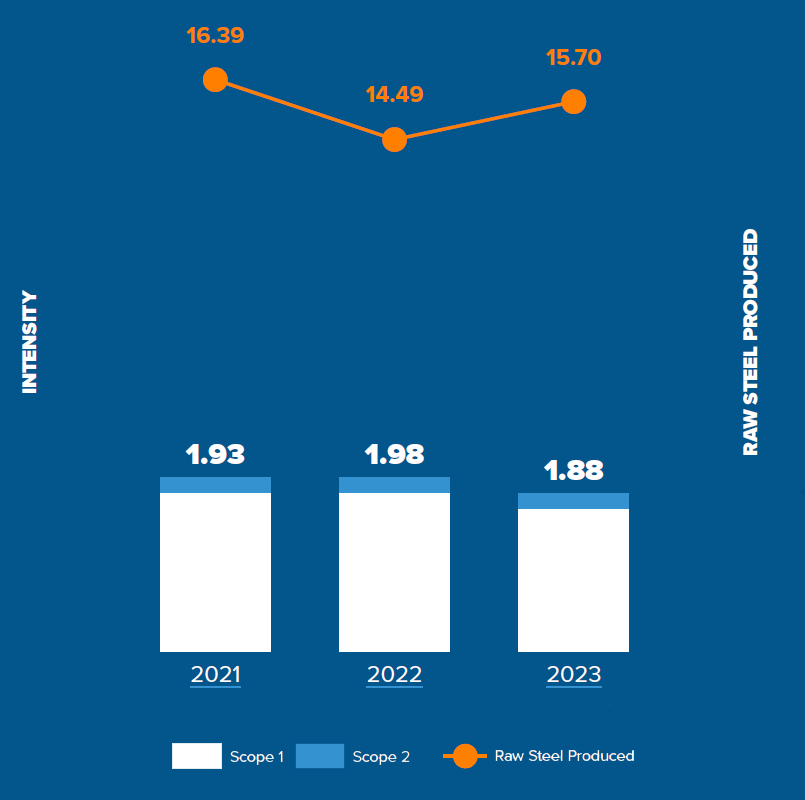
U. S. Steel Annual Total Greenhouse Gas Emissions Intensity and Production for the Global Operations
The GHG emissions intensity is based on the total quantity in metric tons of GHG emissions calculated in accordance with GHG Protocol and EU ETS standards divided by the total quantity in metric tons of raw steel produced globally as published in the U. S. Steel Annual Report and that are processed into finished steel products.

SCOPE 3 EMISSION DETAILS
| Category | 2023 |
|---|---|
| Category 1 – Purchased Goods and Services | 9.36 million metric tons |
| Category 2 – Capital Goods | 0.39 million metric tons |
| Category 3 – Fuel and Energy Related Activities | 5.19 million metric tons |
| Category 4 – Upstream Transportation and Distribution | 1.02 million metric tons |
| Category 6 – Business Travel | 1,869 metric tons |
| Category 7 – Employee Commuting | 13,400 metric tons |
We have undertaken and planned several initiatives that will advance our progress toward our net-zero goal.
Renewables: We are using more renewable energy to power our facilities, and we’ll continue to look for ways to increase our usage, as with the Driver Solar project at U. S. Steel’s Big River Steel Works.
Direct-reduced iron (DRI) with natural gas: DRI reduces our reliance on carbon-intensive coal and coke.
DRI with hydrogen: An emerging technology, using hydrogen will greatly reduce our direct GHG emissions from the DRI process.
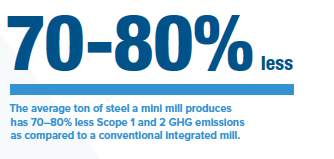
Mini mills: With the addition of U. S. Steel’s Big River Steel Works, we added mini mills that rely on electric arc furnaces (EAFs), which produce 70–80% less GHG emissions than conventional blast furnace/basic oxygen furnaces. We are further expanding our mini mill footprint with the addition of BR2 later in 2024.
Carbon capture: Another emerging technology, carbon capture promises to reduce our steelmaking CO2 emissions by grabbing CO2 out of our process gas waste streams, so that it can be stored, or utilized in a variety of ways.
Electrification and hydrogen use: Electricity and hydrogen can be used to replace carbon-containing fuels.
Electrical grid advances: Improvements to the grid, including the addition of more green energy, will lead to a reduction in Scope 2 emissions and enable Scope 1 reductions.
Offsets and credits: Any remaining emissions-reduction gaps can potentially be closed through carbon offsets or credits.
How We Are Lowering Our Emissions
Cutting emissions through recycling
Swapping diesel fuel for battery power
Reducing natural gas usage
An emissions-cutting remake
Flaring reduction
From 2019 to 2023, Granite City Works has had a 70% reduction in CO2 emissions at the blast furnace gas flare stack, resulting in an estimated reduction of 800,000 metric tons of CO2 and an overall savings of $18 million. This was accomplished by implementing multiple tuning and testing initiatives, conducting one on one operator training sessions, setting individual operator targets, and applying adaptive concepts that encompassed operational changes. To compliment the GHG reduction efforts, we also increased our steam generation to 4,766,000 pounds per hour through additional efficiency implementation. This steam is used for electrical generation and iron and steel production support at the Granite City Works facility.
50,000 MW/h of electrical generation was not expected to be achievable, until 2022 when we exceeded that two times and another two times in 2023. This broke all-time records for electrical generation in the history of the generator since it was constructed in 2009:
- April 2022 — generation exceeded 50,000 MW/h at an actual of 50,124 MW/hours, averaging 69.62MW for the month
- May 2022 — highest monthly generation since the plant was constructed (69.7 MW monthly average equaling 51,837 MW/hours)
- March 2023 — generation exceeded 50,000 MW/hour at an actual of 50,016 MW/hours, averaging 67.23 MW for the month
- May 2023 — generation exceeded 50,000 MW/hour at an actual of 50,686 MW/hours, averaging 68.13 MW for the month
Shipment of products from trucking to rail
*Association of American Railroads. “Freight Rail & Preserving the Environment.” DocsLib.org, April 2021, https://docslib.org/doc/974478/freight-rail-preserving-the-environment
